
Do you work with a variety of KPIs (key performance indicators) that all have different targets? The answer is probably yes and you are not alone. A lot of businesses, especially large marketing and eCommerce agencies have to track performance against a specific KPI. As of recently, Google Data Studio has introduced “Gauge charts” as an available chart format. You can use gauge charts to quickly check how well a given metric is performing against a target goal. The components of a gauge chart include:
- A center bar showing the actual value of the metric you are graphing.
- An optional vertical line showing a target value.
- An optional comparison value.
- Optional colored bands that represent threshold ranges, such as poor, average, and good
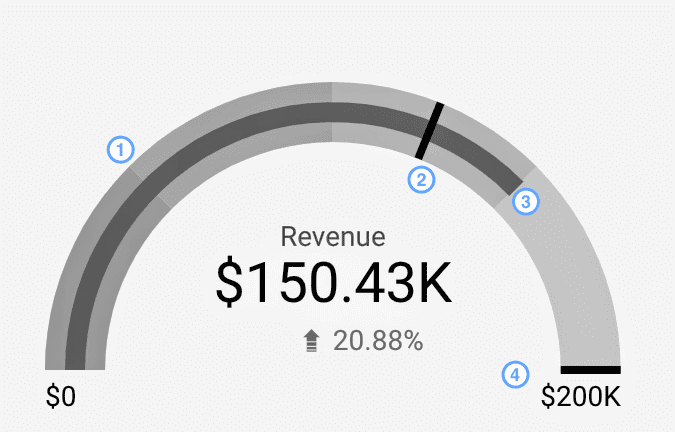
You can customize gauge charts in Data Studio to display minimum, maximum, target, comparison, and up to five ranges, as well as to change chart colors and apply data filters. For example, the below image consists of four shaded bands representing ranges. A comparison with the previous 28-day period. A center bar showing the revenue amount. A target of $200,000.
As such, you can use gauge charts to monitor various “health” or performance KPIs that are vital for your business. Moreover, you can do it in a visually appealing way that resonates with your audience.
My latest Skillshare class covers Gauge Charts and you can access it here for FREE (1-month free trial included).
Gauge Chart Tutorial in Google Data Studio
This is a little preview of the class. If you want me to cover a specific feature in Google Data Studio, feel free to comment, I will be happy to write a content piece on it.
I hope this was helpful! Of course, if you have any questions, feel free to DM me on LinkedIn. Also, you can take a look at my latest Data Studio articles covering data blending and parameters.