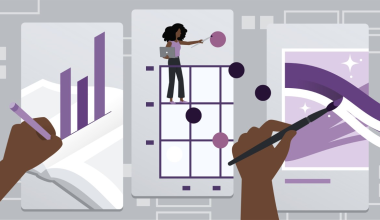
DDesign and Formatting Read More 6 minute read 5 Tips for Data Storytelling and VisualizationbyLachezar ArabadzhievMarch 12, 20237.6K views Although cliché, the phrase “a picture is worth a thousand words” has never been more true than in…
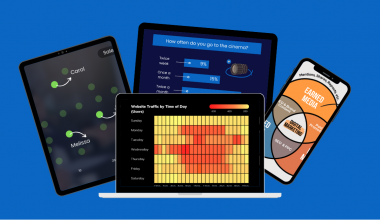
DDesign and Formatting Read More 3 minute read Top 5 Useful Chart Types to Visualize Data in 2023byLachezar ArabadzhievDecember 23, 20226.3K views Data visualization is an important tool for making sense of large amounts of data and communicating insights effectively.…
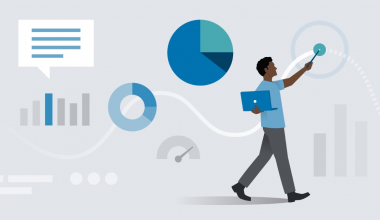
DDesign and Formatting Read More 2 minute read Storytelling for Data and DesignbyLachezar ArabadzhievAugust 31, 20226.2K views From cave drawings and classical mythology to film productions and Broadway plays, storytelling has stood the test of…
DDesign and Formatting Read More 4 minute read Data and Visual Storytelling: The Skillset of The FuturebyLachezar ArabadzhievMay 18, 20226.0K views “This article was originally posted on LinkedIn: Data and Visual Storytelling: The Skillset of The Future” Hey there! I’m…
DDesign and Formatting Read More 2 minute read Whimsical: A Journey Into Visual CollaborationbyLachezar ArabadzhievMarch 15, 20226.4K views 📢BIG NEWS: Super excited to announce our new LinkedIn Learning course covering the field of visual collaboration using Whimsical is now LIVE!…
DDesign and Formatting Read More 2 minute read Data and Design with Canva: A Visual Storytelling JourneybyLachezar ArabadzhievOctober 23, 20216.9K views Now, I have talked a lot about data analysis, measurement, and visualization in my articles, but I wanted…
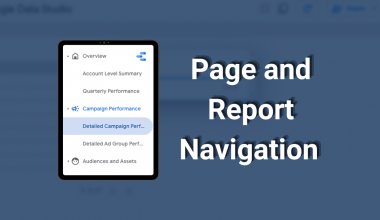
DDesign and Formatting Read More 5 minute read Advanced Page and Report Navigation in Google Data Studio – 2021byLachezar ArabadzhievOctober 17, 2021162.9K views Google is always updating Data Studio’s features to improve user experience (UX). This time they have introduced new…
DDesign and Formatting Read More 2 minute read How to configure a gauge chart to track performance against a goal?byLachezar ArabadzhievAugust 18, 202113.7K views Do you work with a variety of KPIs (key performance indicators) that all have different targets? The answer is probably…
DDesign and Formatting Read More 1 minute read How to filter metric values with a slider control in Google Data Studio?byLachezar ArabadzhievJune 24, 202014.8K views In this post, I want to show you how to use the slider control in Google Data Studio…