
Although cliché, the phrase “a picture is worth a thousand words” has never been more true than in today’s media-centric society. Powerful data storytelling can take tables of dry statistics and transform them into a compelling narrative. However, this process is easier said than done. How do you make your visuals stand out in a world of colorful charts and catchy graphics? This article provides five straightforward tips to communicate complex information in clear, engaging, and memorable ways.
The full list of tips and tricks can be found in my LinkedIn Learning course called “Nano Tips for Data Storytelling and Visualization with Lachezar Arabadzhiev“.
1. Don’t Reuse the Same Charts Across Multiple Platforms
Although it’s tempting to reuse graphics across multiple platforms, do not fall prey to the temptation. While it may save you time and effort in the short term, it can lose crucial engagement in the long run. There is too much digital chaos today, and reposting the same chart across multiple platforms makes your message less effective.
Different platforms have different requirements for image size, resolution, and format. A chart that looks good on Instagram will not have the same appeal on Facebook. More importantly, your page will have a different audience demographic. Your TikTok and YouTube Shorts viewers may have some crossover, but the overall demographics will vary by platform. These users will have different levels of familiarity with data and visualizations, so a chart on one platform will not have the same resonance with another audience. Plus, users following you on multiple platforms will find the repetition boring and not engaging.
Audiences are more intelligent than ever. Do not repost without thinking. You must produce adaptive visualizations that speak to each audience and each specific platform. A great example of this is the World Economic Forum. Their Instagram account never publishes posts with complicated charts or schematics, even when engaging with data-heavy subjects. Instead, they introduce a catchy statement with a video sequence that hooks viewers to explore further on their main site. They keep intensive statistics and more complex explanations that elaborate on the key hook of the video on their website. Instead of blindly reposting, use this strategy to analyze your audience based on the platform and consider what will capture their attention most effectively.
2. Make Your Graphics Interactive
In the past, presentations, magazines, and books have all relied on static charts. Static charts are graphics where the data presentation remains the same, and viewers cannot interact with it. By definition, static charts are less able to engage with an audience, and most people’s eyes glaze over when they see one. However, with modern advancements in data visualization technology, you can now easily make your graphics interactive.
Using a tool like Flourish, you can bring your charts to life. With just a few simple steps, you can open a ready-made template. One of the most popular templates is the “bar chart race” because it presents several categories of data and their changes over time. With Flourish, you can open this template or a template like it and configure the data and interactivity level to your specific needs. You can make hundreds of minor customizations and optimizations to display your data story more effectively and prompt your audience to engage meaningfully.
While using interactive charts doesn’t guarantee your message will be communicated perfectly, they are often the best solution to present a strong data narrative. These interactive charts are perfect for situations with massive amounts of data, complex data relationships, and intricate interdependencies.
3. Get Familiar with Chart Groups and Know When to Use What Graph
There are many chart types and techniques to depict data, and understanding which chart to use for a specific data set is crucial. It can completely change your message and its effectiveness. Here’s a quick overview of the core chart groups.
Line Charts

A line chart displays data as a series of points connected by straight lines. It is perfect for showing trends or changes in data over time. The horizontal axis represents time or a sequence of values, while the vertical axis represents the magnitude of the data being plotted.
Bar Charts
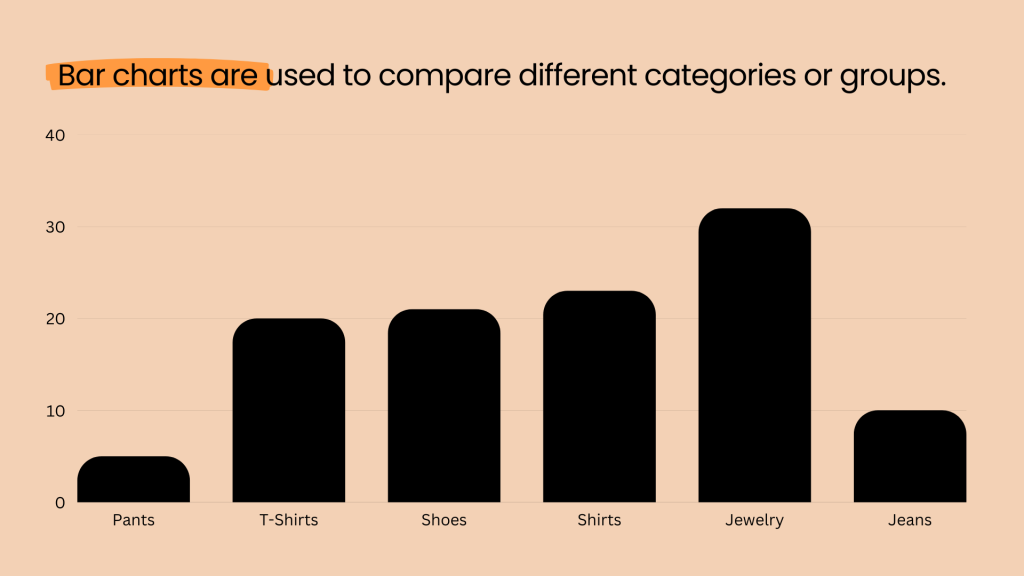
A bar chart represents data with rectangular bars. The bar’s length or height corresponds to the data plotted value. People typically use bar charts to compare discrete categories of data, and the bars can be horizontal or vertical. The vertical axis represents the magnitude of the data, while the horizontal axis represents the categories being compared.
Pie Charts
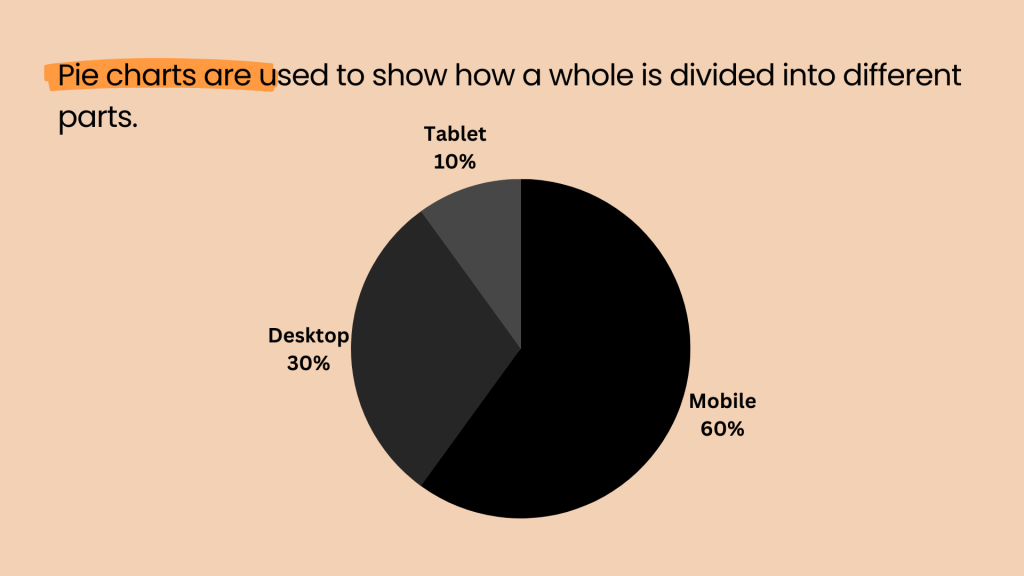
The pie chart is one of the most recognizable chart types. The pie chart shows how the whole of a data set is divided into different sections. It’s typically used to display percentages or proportions of data that add up to 100%. The size of each segment is proportional to the value it represents, and the segments are typically labeled to indicate the category of data they represent.
Scatter Plots
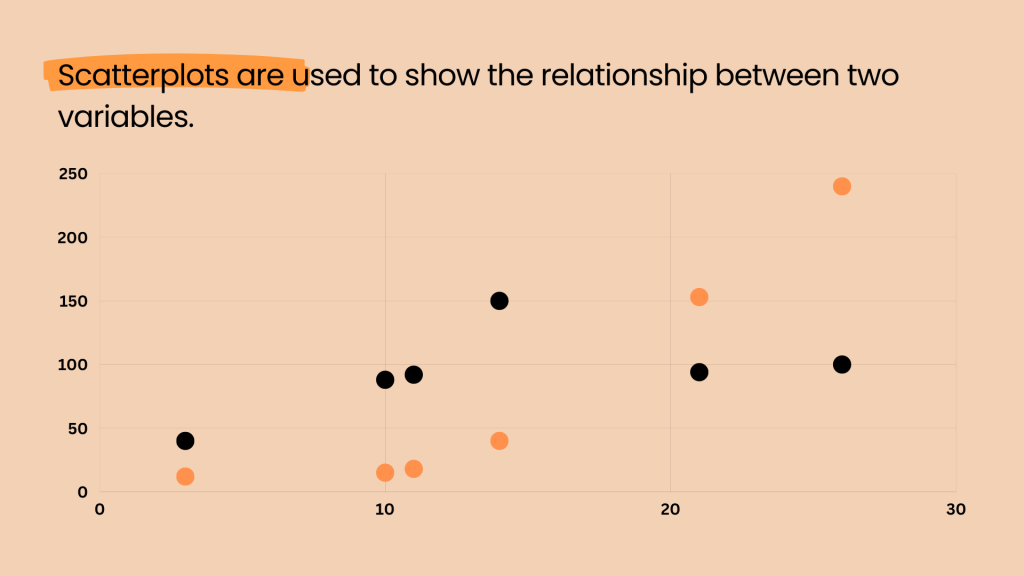
A scatter plot displays the relationship between two variables. It is made up of individual points, with each point representing a single observation in the data set. The position of each point is the value of the two variables, and the pattern of the points indicates the strength and direction of the relationship between variables. It’s helpful for identifying patterns and trends in the data.
Sankey Charts
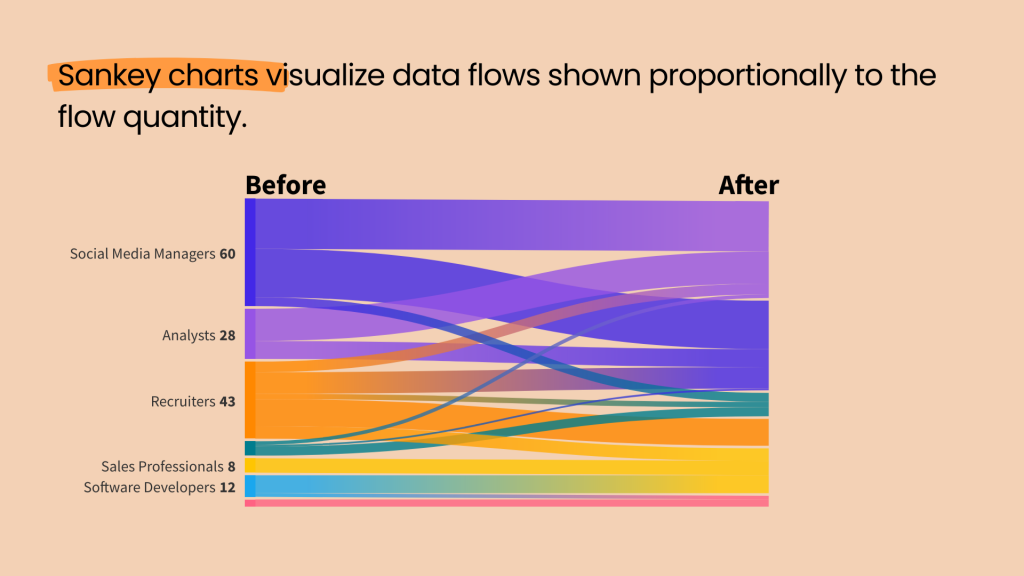
One chart you might not have heard of before is the Sankey chart. A Sankey plot is a kind of flow diagram that illustrates the flow of a particular quantity through a system. The plot consists of nodes (boxes) and edges (lines) that connect them, with each line’s width representing the flow’s magnitude. It is commonly used to visualize the flow of energy, resources, or money through a complex system. It can identify inefficiencies, track the movement of variables, and display the interdependencies between different processes or activities.
4. Take Advantage of AI to Simulate Data Presentation
When you’re in the first stages of data visualization development, it’s crucial to brainstorm different ideas to discover the format that tells your data story in the best possible way. In the past, this brainstorming would happen by searching for similar examples on the Internet, listening to other people’s thought processes, and coding different simulations to see what looked best. However, coding these simulations could be a significant barrier to workers, who found the Python and R libraries overwhelming.
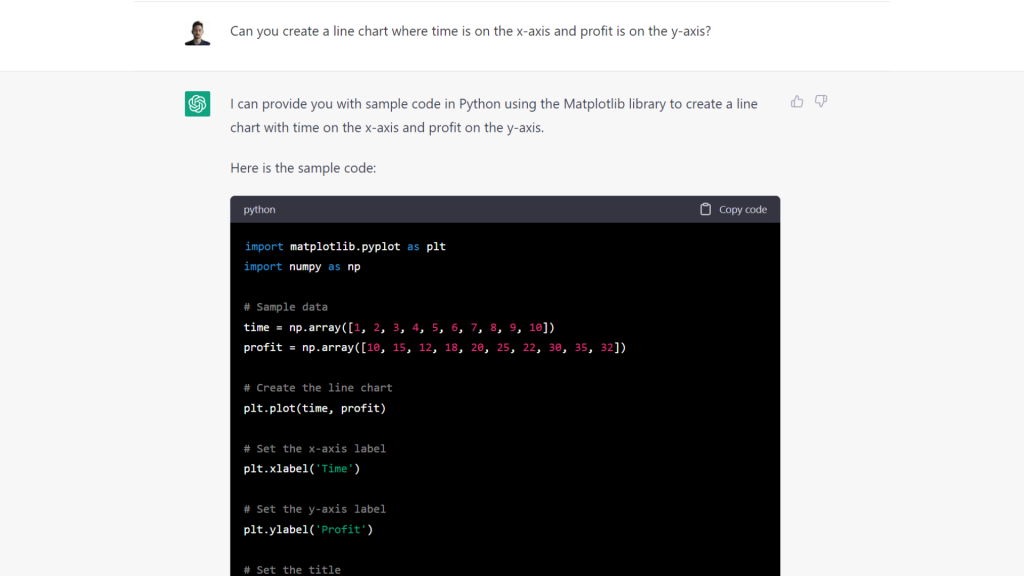
Luckily, an exciting option has entered the space. With the help of iterative AI tools like ChatGPT, you can take advantage of open AI technology to code different simulations for you. Code can be as descriptive as you want, but it’s important to note that too many details can confuse the software. ChatGPT is most helpful in creating a coding foundation or template for more complicated data sets, but for easier relationships, it can create simulations with ease. This option can save you a lot of time and help you explore options you may not have thought of by yourself.
5. Presentation is Everything
Compelling data storytelling doesn’t end when you have your charts. Presentation is everything, and planning how to introduce your graphics best is crucial. Great presentation techniques will enhance your message even further, and poor presentation traps can leave audiences glazing over your diagrams. Here are three tips to present your graphics successfully.
Build a Narrative with Your Data Story
Adding a few slides with your charts will not connect with your audience. It won’t tell them what the charts are for or why they are essential. Instead, focus on deconstructing a single chart into a few different components. Explain those components clearly and individually to create a better narrative.
Always Use Visual Aids
Charts are naturally a visual medium, but many people don’t take full advantage of this. Make sure to use visual cues and highlight points on your chart that are the most important. These visual cues can be as simple as coloring the minimum and maximum values in different shades or using a gradient shade for changing data. If you use transitions, practice timing your verbal explanations with the visual highlight to make the point stick with your audience for longer.
Time Your Explanations
A common mistake in remote and in-person presentations alike is to start explaining a chart before it’s even shown. While you should lead into your chart before showing it, you should never begin explaining the graphic before presenting it to the audience.
Hope you enjoyed our data storytelling tips! If you have any questions, feel free to do one of the following:
✅ Explore my LinkedIn Learning courses on storytelling through data and design!
✅ Find out why Data and Visual Storytelling a the Skillsets of the Future.
✅ Subscribe to receive the by-weekly “My Next Story Is…” newsletter. Yep, it is my brand new newsletter!