It’s here folks! Google Data Studio has finally introduced the remaining JOIN types. Initially, the Data Studio Team had only released the LEFT OUTER JOIN option, which returns matching rows on the right and non-matching rows to the left. However, the latest functional improvement adds four more advanced join types to make data blending easier.
In this post, we will look at the different join types and how you can use them effectively, but first, let’s do a little data blending recap.
What is data blending?
Data blending refers to combining data from multiple data sources to create charts, controls, and tables. Often, data blending is considered an “analyst-only” skill, since it used to require a deep understanding of SQL programming. However, Data Studio allows users to blend data using drag and drop features, and makes the entire process accessible to those without technical backgrounds.
If you haven’t explored data blending and are just getting accustomed to the concept, you can take a look at our Definitive Guide to Data Blending in Google Data Studio. The guide will help you understand the basics before you dive into advanced data blending.
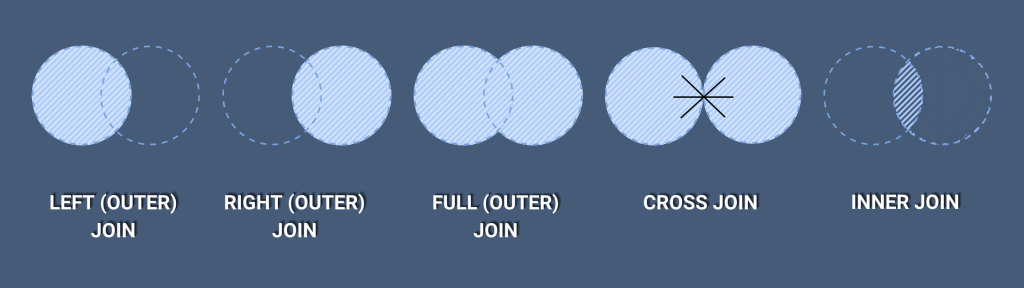
Now, as of 2022, Google Data Studio has five join configurations that you can choose from while blending your charts and tables. A join configuration features an operator that defines how the matching and non-matching will be combined. It also consists of a condition that defines how the data sources are related. These join configurations include:
1. Inner Join (New*)
Inner Join is also referred to as Join. This join type will only return the matching rows from the left and right tables. It discards all data that do not meet its condition. It gets rid of all rows that do not match the join condition.

2. Left Outer Join
The left outer Join returns both matching and non-matching rows from the left and right tables. This was the only join type available until recently. Its called left because it returns all the rows from the left even when rows on the right do not match. If a row does not match or join with a row on the right, it will return NULLs to the columns on the right. The left outer Join gets rid of rows on the right that do not join any left row.

3. Right Outer Join (New*)
The right outer Join returns both matching and non-matching rows from the right and left tables. It works asymmetrically and similarly to the left outer Join.

4. Full Outer Join (New*)
It only returns the matching rows from the right or left tables. Full in the full outer Join shows that all rows are returned even if they do not meet the conditions. Outer indicates Null to columns that do not join any row.

5. Cross Join (New*)
It returns all the possible combinations on the rows on the right and left tables.

What are Join Conditions?
Join conditions refers to a field or fields used to join two tables. For example, you can use Campaign name to join data from google ads and google analytics. Note that the field’s name doesn’t have to be the same for you to join two tables. As long as the data is the same, the fields can have different names.
How to blend data using Join Configurations in Google Data Studio?
In this example, we will use data from a group of students that take different classes. We will then use data studio to blend data and get meaningful visualizations that answer the following questions.
- Which students take which classes?
- What grades did they score?
- Who scored the highest grade in each class?
- What was the highest score in each class?
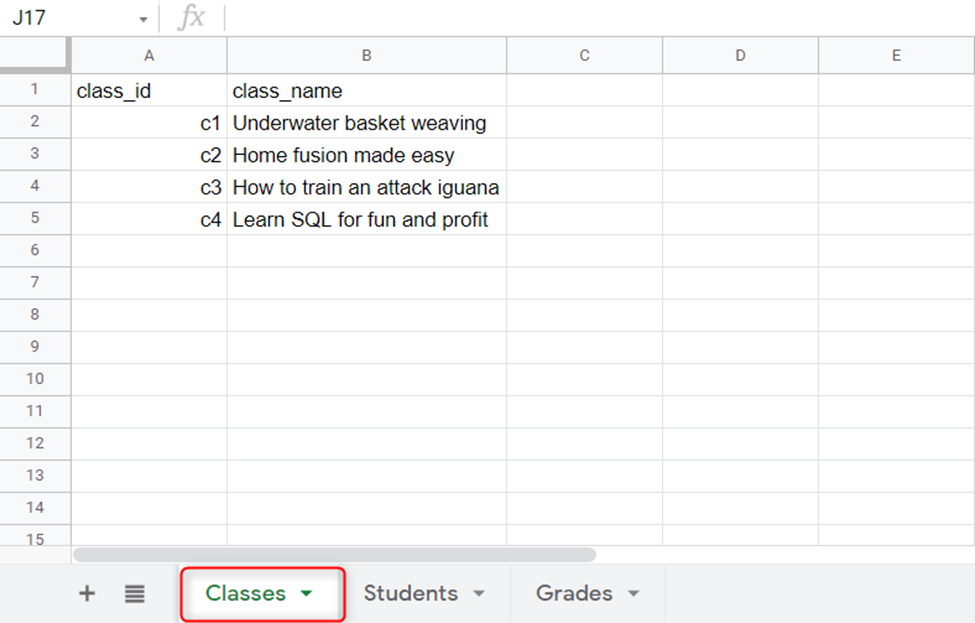
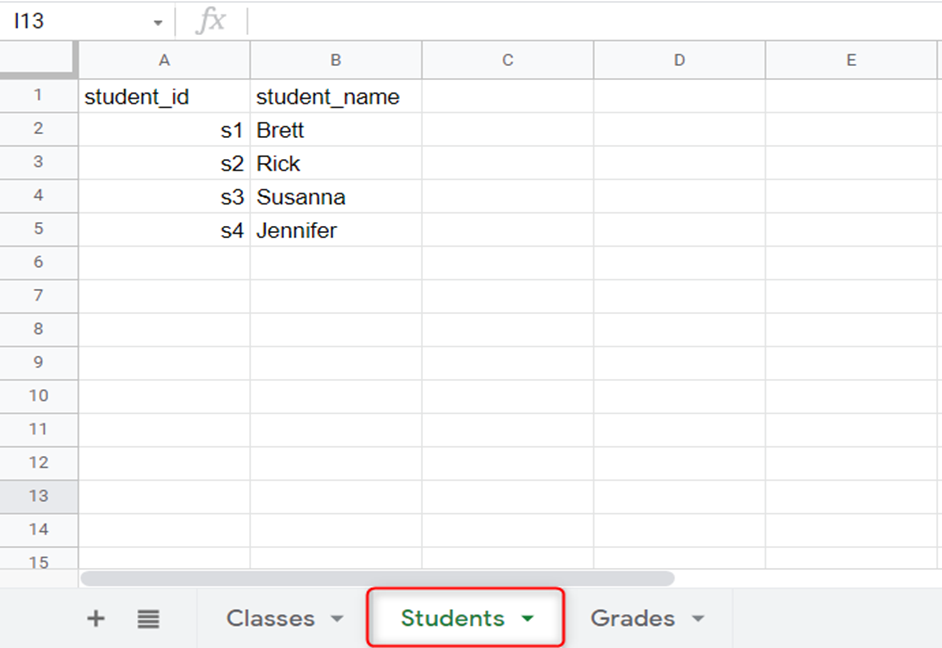
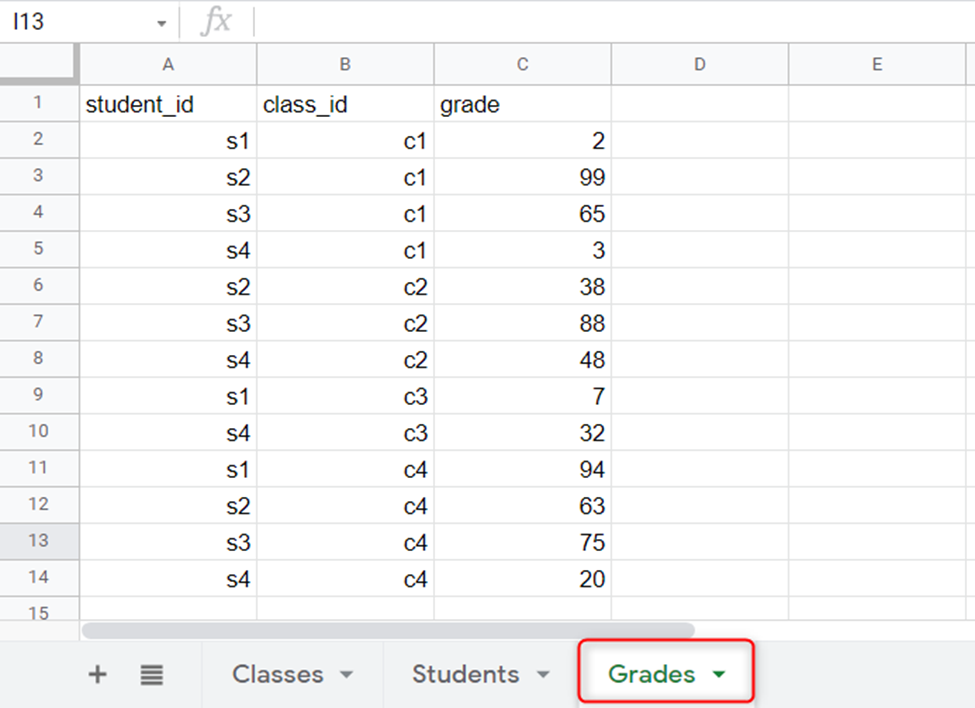
1. First, we will load the data into Google Sheets (Remember, you can use your favorite connector type or Supermetrics as well). Each sheet contains a unique table.
Sample Tables
Classes
Students
Grades
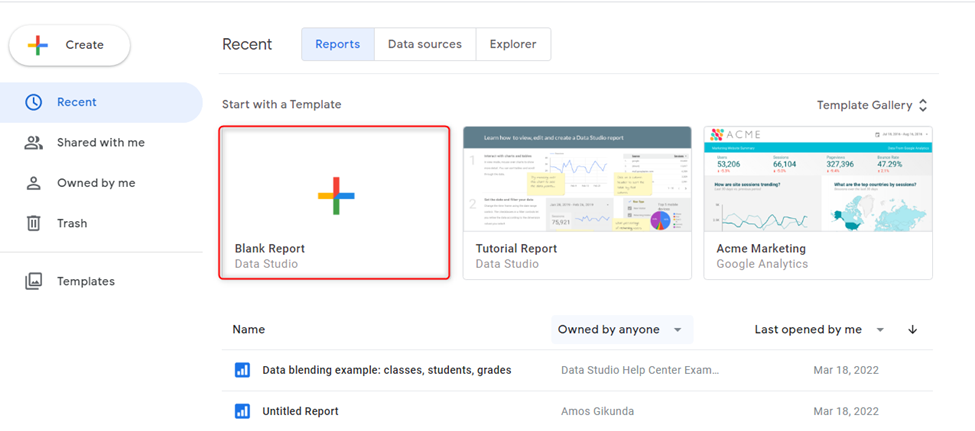
2. Launch Google Data Studio and click on Blank Report.
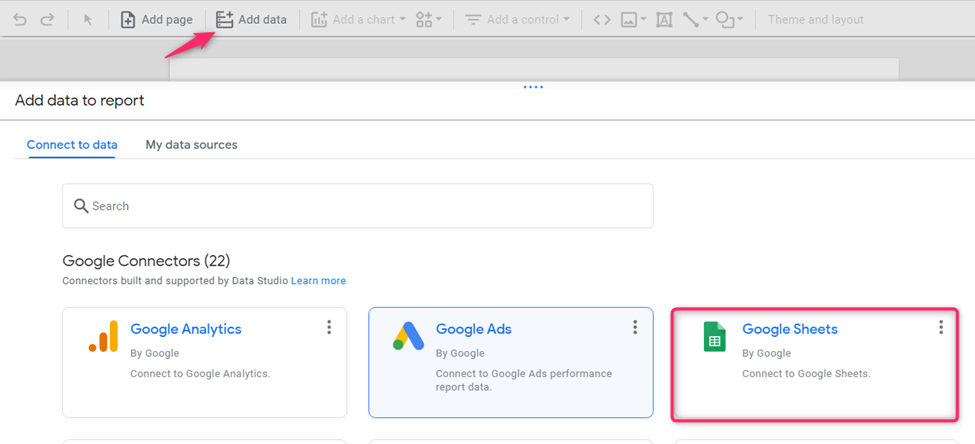
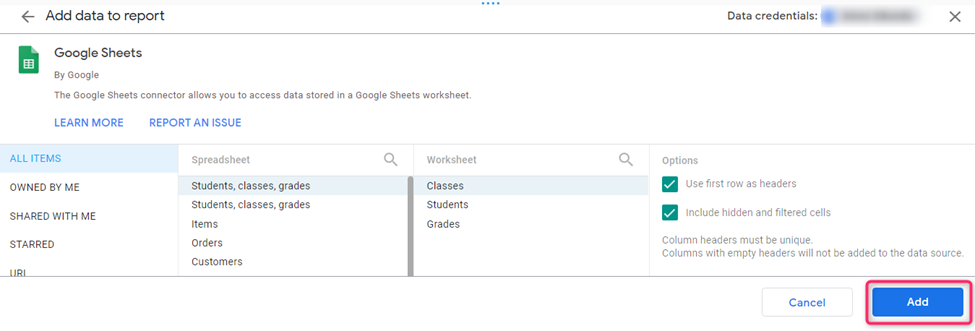
3. Click on Add data and select the connector that contains your data.
4. Add your tables or charts to the report one by one.
5. After adding all the required tables, click on Blend Data
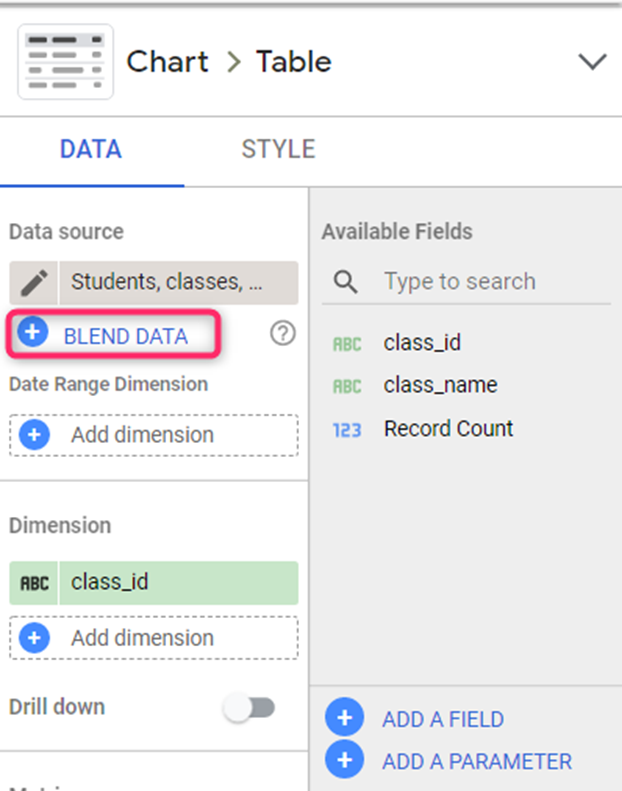
6. Add dimensions of the tables using drag-and-drop.
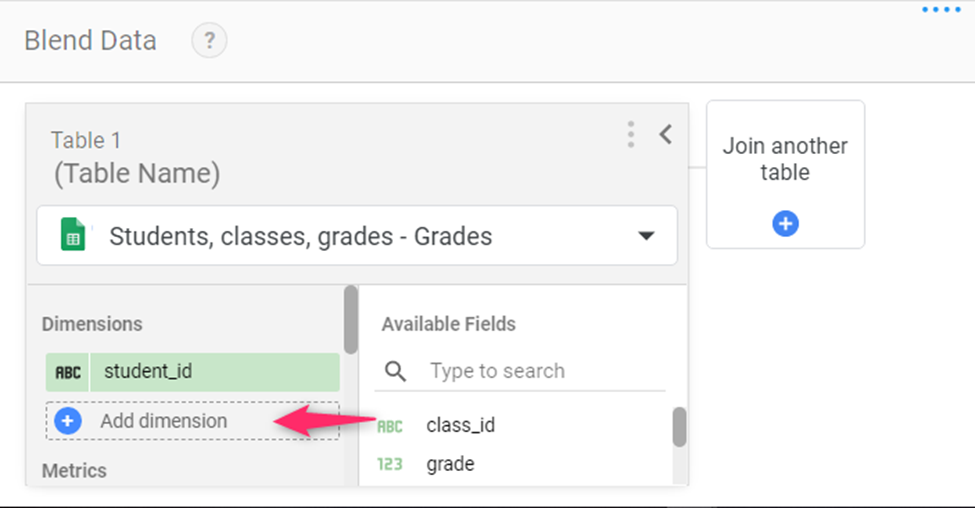
Click join another table to add the next table.
Grades
- student_id
- class_id
- Grade
Students
- student_id
- Student_name
Classes
- class_id
- class_name
7. Rename the tables for easy identification.
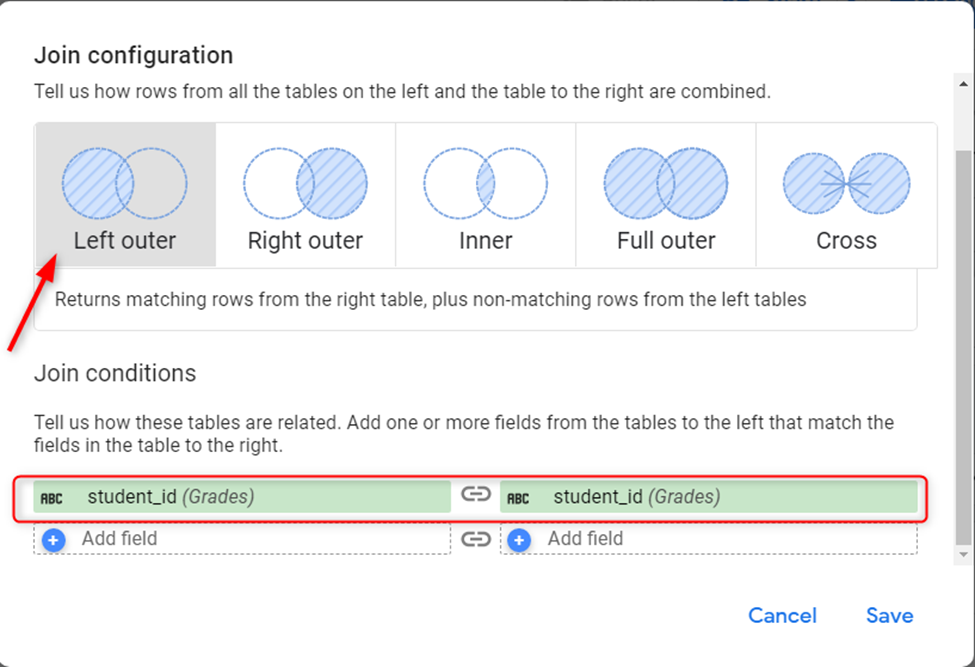
8. Blend the tables by clicking configure joins.
For example, let’s join grades to students. These two tables are related because they both have a student ID. So set student_id as the join condition. Select left outer Join and then click Save.
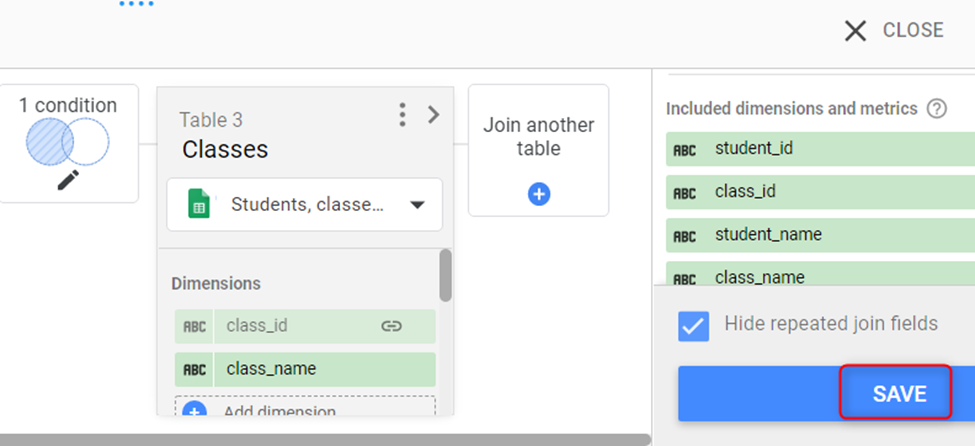
Repeat the same procedure to join students and classes, but this time use class_id as the relationship. (Class_id appears on both tables)
9. After joining the three tables, click on save.
10. Click on view to zoom-in on the data.
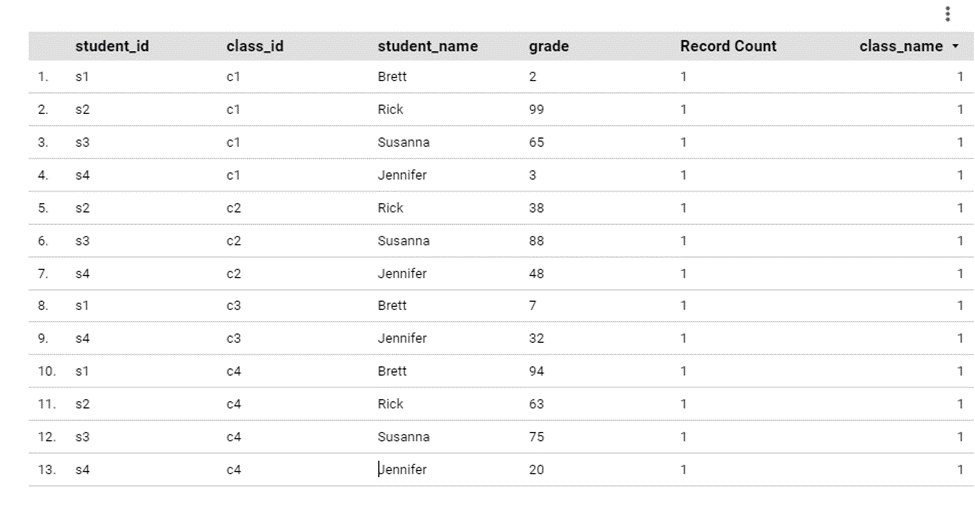
That’s it! You have blended your first data using the left-outer join operator. You can use the other join operators to answer more questions or focus on specific areas of your business/data.
Once you blend the tables, you can convert the final table into charts to get more visualizations that will help you study the data with ease. You can also play around with the join operators to view the data differently. For example, the cross join operator will show you all the possible data combinations.
Differences between Data Sources and Blends
People usually confuse data sources and blends when using the Data Studio. Blending tables or charts create a new resource called blends. The main reason why people often get confused is that blends function the same way as data sources. However, there are still some distinct differences.
- Blends depend on multiple data sources for information.
- Blends are tied to the report that they are created. It means that blends can’t be used across different reports. The only way to use them in another report is by copying a report to another report.
- Blends inherit credential settings and data freshness from data sources.
Final Thoughts
The easiest way to study the relationship between two data types is by blending them. Before data blending, data analysts relied on SQL programmers to join multiple data sources to create unified charts and tables.
As tools like Google Data Studio are evolving and becoming more visually-driven, anyone can practice advanced data blending using the five join types. All you need to understand is how to create and edit data sources, and from there, you can start your data blending journey.
I hope this was helpful! If you have any questions on advanced data blending, feel free to subscribe to my newsletter or take a look at one of our courses.
Dynamic Dashboards and Data Analysis with Google Data Studio – 2022
If you want to learn how to build powerful data visualizations and unlock insights that can help you drive business results for your clients or employers, take a look at my full course on Udemy.

Google BigQuery for Marketers and Agencies
This course is designed to bridge the gap between data analysis and digital marketing, and help you become a data-driven decision-maker. It covers the more technical aspects of JOINs and data blending as well. You can access the full course here as well.